
技術・トレンド
歩くことが健康に良いということは、皆さんなんとなく認識していると思います。
単純に歩くだけではなく、ある程度の速さで歩くこと(一般的にはウォーキング)も健康に良いということもなんとなく認識しているかと思います。
健康診断の結果、ダイエットや運動のためにウォーキングを始める人はいませんでしょうか。
あるいは医療費の節約や健康であり続けたいということで、ウォーキングをしている人はいませんでしょうか。
なんとなくではなくエビデンスを持って健康に良いかどうかを知るために、研究も
されてきました。
その結果、近年では歩行速度が健康年齢や寿命と関連しているというエビデンスが出てきています。
歩行速度が速いほど平均寿命や健康寿命が長い傾向があるそうです。
海外では足の専門病院(足科・足病科・ポダイアトリー)が一般的になっている中、日本でも足の専門病院が開設される動きが出てきたりと足への関心が高まっています。
そこで今回は歩行速度が健康に関連しているということで、日常生活でウォーキングしている人の歩行速度はどのくらいなのかを、弊社に蓄積されているデータから調べてみました。
※ 弊社アプリ日々の歩数や移動などの位置情報と写真を自動的に記録するアプリ「SilentLog」より収集したデータに匿名化処理を施したもの
※ データはあくまで弊社サービスで収集したもので、実際とは異なる場合がございます
歩行速度と推定属性情報
移動時間によって次の通りに仮定
2022 年 1 月 1日(土)〜 12月31日(土)の1年間
47都道府県
期間内にログがある方
まずは年代別で平均歩行速度・距離をみていきたいと思います。
次の図は年代別での平均歩行速度を表しています。

当たり前の結果かもしれませんが、ウォーキングの方が徒歩よりも平均歩行速度が速い傾向を示しています。
細かく見ると、徒歩の方は各年代で差があまりなく時速 3.5 kmほどですが、ウォーキングでは各年代に差があり時速 4.5 kmの付近で幅があります。
今回の結果では、ウォーキングにおいては50代が最も速く移動していることが示されています。
若い年代の方が速いというわけではないようです。
徒歩では 70 代以降になると遅くなっていますが、ウォーキングになると速い方もいることがわかります。
歩行速度が速いほど平均寿命や健康寿命が長いという観点で見ますと、80 代が 20 代と同じくらいの速度でウォーキングしていることがわかります。
次の図は年代別での平均歩行距離を表しています。

ウォーキングと徒歩を 30 分を境に分けているのでウォーキングと徒歩の距離に差が出ていますが、今回は置いておきます。
傾向としては歩行速度の時と同様に、徒歩の方は各年代で差があまりないようですが、ウォーキングでは各年代に差があります。
速度と異なり、若い方が長い距離を歩いていないことがわかります。
同じくらいの速さだった 20 代と 80 代で 500 mほど差があります。
この関係性を確認するために歩行時間も見ていきます。
次の図は年代別での平均歩行時間を表しています。

ウォーキングに費やしている時間は、若いほど少なく、高齢になると多く費やしていることがわかります(もしかしたら散歩が含まれている可能性もございます)。
この傾向から同じくらいの速さだった 20 代と 80 代で 500 m ほど差が出たことがわかります。
徒歩に関しては、中年期が少しだけ他の年代より少ない傾向が見えます。
ここまでは年代別で見てきましたが、地域別でも見てみたいと思います。
次の図は地域別の平均歩行速度になります。


ウォーキングと徒歩の速さに地域差があることがわかります。
ウォーキングは地方が速いですが、徒歩に関しては関東圏や 6 大都市といわれる地域の方が速い傾向を示しています。
ウォーキングの中でも高知県、大分県は時速 5 kmを超えています。
距離に関しても見ていきます。
次の図は地域別の平均歩行距離になります。

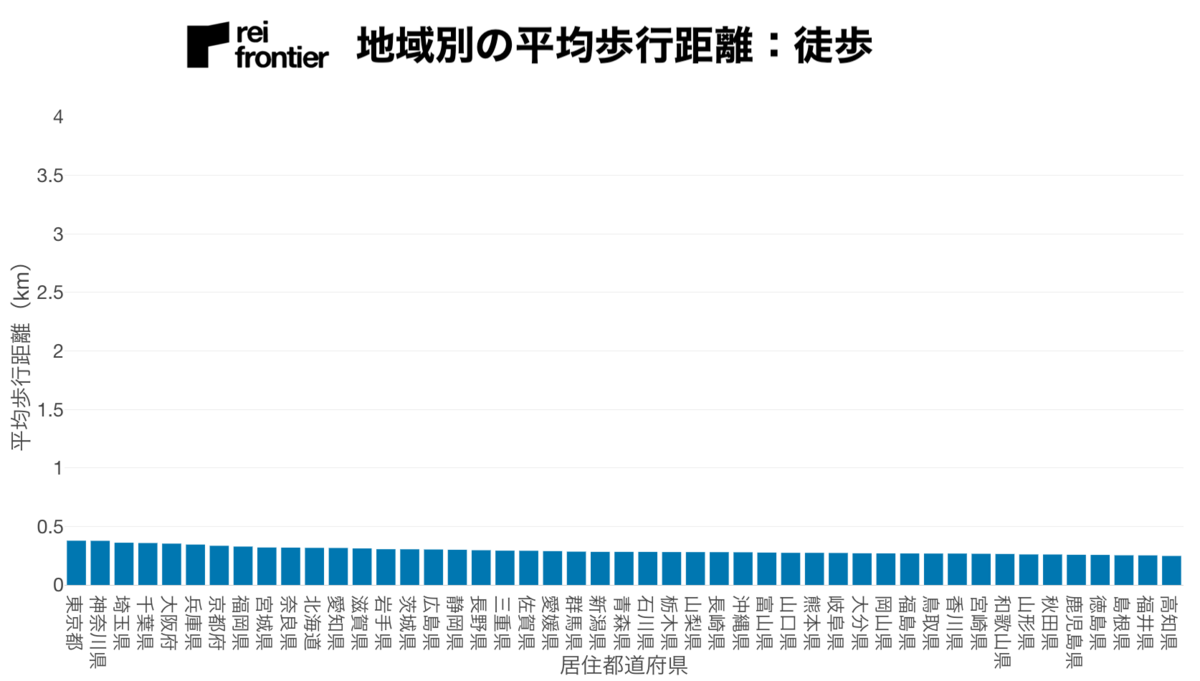
年代別と同様にこちらもウォーキングと徒歩を 30 分を境に分けているのでウォーキングと徒歩の距離に差が出ていますが、今回は置いておきます。
歩行速度と同様に距離に関してもウォーキングは地方が、徒歩に関しては関東圏や6大都市といわれる地域の方が長い傾向を示しています。
ウォーキングに関しては歩行速度で上位だった県が、例えば距離では 1 位であった高知県が上位に入っていません。
代わって速度では上位に入っていなかった宮崎県が距離では 1 位に入り、宮崎県、大分県ともに 4 kmを超えています。
年代別と同様に、ウォーキングに費やす時間が異なるのかもしれませんので、時間でも確認していきたいと思います。
次の図は地域別の平均歩行時間になります。


ウォーキングに費やしている時間は、宮崎県、鳥取県、佐賀県の 3 県が 50 分を超えています。
高知県に関しては 40 分ほどになっています。
このことから速度で 1 位だった高知県が距離では上位ではなくなったことがわかります。
徒歩に関しては、速度・距離と同様に関東圏や 6 大都市といわれる地域の方が長い傾向を示しています。
ウォーキングでの速度・距離・時間の 3 つで常に上位だった県は、大分県、富山県だったことがわかりました。
地域差が出ているのはもちろんインフラや産業構造の影響も考えられます。
大分県に関しては「 厚労省発表の健康寿命の令和元年値について」の 2019 年で健康寿命が1 位だったのはウォーキングの影響もあるかもしれません。
※ データはあくまで弊社サービスで収集したもので、実際とは異なる場合がございます
以上、ここまでお読みいただきありがとうございました。
【追記】
2024年2月20日に最新のデータを元に『2023年のデータをもとに歩行速度を調査 /年代・地域別』の調査結果を公開しました。
この度iPhone版同様にお使い頂けるSilentLog、Android版をリリースしました。
今後とも宜しくお願い致します。
Android版
https://play.google.com/store/apps/details?id=jp.reifrontier.silentlog
iPhone版
https://apps.apple.com/jp/app/silentlog/id901679160

毎日の振り返る楽しさを「プラス」するアプリ
SilentLogの公式サイトはこちらです

 レイ・フロンティアの公式サイトはこちらです
Most of us are vaguely aware that walking is good for our health. Not only walking itself, but walking at a certain pace—typically referred to as “brisk walking”—is also known to be beneficial.
Some people may start walking after a health checkup, for diet purposes, or simply to stay healthy. Others may walk with goals such as reducing medical costs or maintaining long-term well-being.
To move beyond assumptions and truly understand how walking affects health, many studies have been conducted. Recent evidence suggests that walking speed is closely related to health age and life expectancy—people who walk faster tend to have a longer average lifespan and healthier aging.
In Japan, interest in foot health is rising, with specialized foot clinics now appearing, similar to what has already become common in countries with established podiatry fields.
In this study, we analyzed walking speed data of everyday walkers using anonymized records collected via our app SilentLog, which automatically logs users’ location and movement patterns.
・Based on anonymized behavioral data collected via SilentLog, our smartphone app that automatically records users’ daily steps, movement, and photos.
・Please note this data was collected through our service and may not fully reflect actual real-world conditions.
・Content: Walking speed and estimated demographic information
・Classification:
More than 30 minutes = “Walking”
Less than 30 minutes = “Walking (short)”
January 1, 2022 – December 31, 2022
All 47 prefectures of Japan
Users who logged data during the survey period
The chart below shows the average walking speed by age group.
As expected, longer walks (30 minutes or more) showed faster average speeds than short walks.
・For short walks, walking speeds across age groups remain consistent at around 3.5 km/h.
・For long walks, average speeds differ by age, generally around 4.5 km/h, with variation.
・Interestingly, the fastest walkers were in their 50s, not the youngest group.
・Even among those in their 80s, some walked at speeds comparable to people in their 20s.
This supports the notion that walking speed may indicate longevity and wellness, regardless of age.
Next, we examine average walking distance by age group.
While the time classification (30 minutes) naturally results in a distance gap between short and long walks, we focus here on age-related trends:
・Short-walk distances are fairly consistent across age groups.
・In contrast, long-walk distances vary significantly by age.
・Younger groups do not necessarily walk longer distances.
・There is a 500-meter gap between those in their 20s and those in their 80s, despite similar speeds.
Let’s now look at average walking time by age group.
・For long walks, older users tend to walk for longer periods than younger ones—possibly because their walks include leisure or relaxation.
・This explains the 500-meter difference in distance despite similar speeds between younger and older groups.
・For short walks, middle-aged users appear to walk slightly less than other age groups.
Now let’s examine regional differences.
The chart below shows average walking speed by region.
・There are clear regional differences in both short and long walk speeds.
・Long walks are generally faster in rural areas, while short walks are faster in urban regions like the Tokyo metropolitan area and the six major cities.
・Notably, Kochi and Oita Prefectures recorded speeds over 5 km/h for long walks.
Next, we explore average walking distance by region.
As with age groups, the 30-minute threshold creates a clear distance gap between short and long walks. Let’s look at the trends:
・Long walks tend to cover greater distances in rural areas.
・Short walks are longer in urban centers, particularly in the Kanto region and the six major cities.
・Despite having the highest speed, Kochi Prefecture did not rank among the top for distance.
・Meanwhile, Miyazaki and Oita Prefectures both logged long-walk distances exceeding 4 km.
Now let’s see the average walking time by region.
・Residents of Miyazaki, Tottori, and Saga Prefectures spent the most time walking (over 50 minutes).
・Kochi Prefecture, despite ranking #1 in speed, only averaged about 40 minutes.
・This explains why Kochi didn’t top the distance ranking.
・For short walks, urban regions again showed longer durations, consistent with speed and distance trends.
・Speed
Long walks are faster than short walks
Short-walk speed is consistent across ages (~3.5 km/h)
Long-walk speed varies by age (~4.5 km/h)
People in their 50s walk the fastest
Some people in their 80s walk at the same pace as those in their 20s
・Distance
Short-walk distances are consistent across ages
Long-walk distances vary by age
Younger people do not necessarily walk longer distances
20s vs. 80s: ~500m distance gap despite similar speed
・Time
Older users spend more time walking than younger users
For short walks, middle-aged groups walk slightly less
・Speed
Regional variations exist in both short and long walks
Long walks are faster in rural areas
Short walks are faster in urban areas
Kochi and Oita exceeded 5 km/h for long walks
・Distance
Long walks cover greater distances in rural regions
Short walks are longer in urban centers
Miyazaki topped the distance chart despite not leading in speed
Miyazaki and Oita both exceeded 4 km
・Time
Miyazaki, Tottori, and Saga recorded the longest walking durations (over 50 minutes)
Kochi averaged ~40 minutes
Urban areas had longer short-walk durations
👉 Overall, Oita and Toyama Prefectures consistently ranked among the top in all three categories: speed, distance, and time for long walks.
These regional differences may reflect local infrastructure, industry, or lifestyle patterns.
In fact, Oita ranked #1 in Japan for healthy life expectancy in 2019, according to the Ministry of Health, Labor and Welfare—perhaps walking habits play a role!
On February 20, 2024, we released the latest version of this study:
“Walking Speed Study Based on 2023 Data: By Age Group and Region.”
We’re pleased to announce that the Android version of SilentLog is now available—offering the same features as the iPhone version.
✨ Add a little joy to your daily reflections with SilentLog.
Official SilentLog Website
Visit our official website:
👉 Rei Frontier Inc.
Follow us on social media:
Twitter: @reifrontier
YouTube: Rei Frontier Channel
Instagram: @reifrontier
👉 Contact Page
✉️ Email: info@rei-frontier.jp
【お問い合わせ先】